【Notification of Manufacturer Change for Panasonic Industrial Devices SUNX Products and Panasonic Industrial Devices SUNX Tatsuno Products】
From April 1, 2024, the terms "Panasonic Industrial Devices SUNX Co., Ltd." and "Panasonic Industrial Devices SUNX Tatsuno Co., Ltd."
in this page and in the manuals and other documents to be downloaded will all be replaced with "Panasonic Industry Co., Ltd." and applied accordingly.

 Business
> Industrial Devices
> Automation Controls Top
> FA Sensors & Components
> Sensors
> Photoelectric Sensors / Laser Sensors
> Convergent Reflective Photoelectric Sensor EX-40
> Sensing characteristics
Business
> Industrial Devices
> Automation Controls Top
> FA Sensors & Components
> Sensors
> Photoelectric Sensors / Laser Sensors
> Convergent Reflective Photoelectric Sensor EX-40
> Sensing characteristics
Convergent Reflective Photoelectric Sensor EX-40
|
Partly Order Discontinued
|
|
Sensing characteristics
EX-42
|
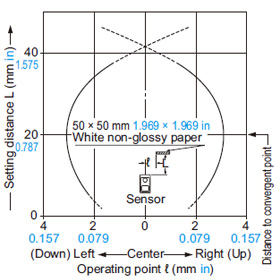
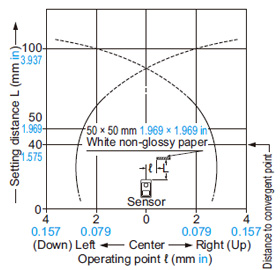
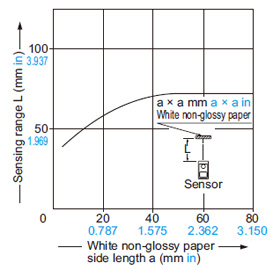
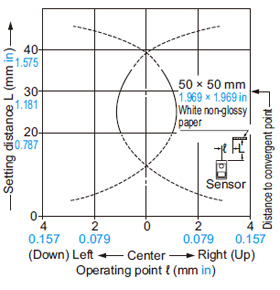
Correlation between sensing object size and sensing range
 |
As the sensing object size becomes smaller than the standard size (white non-glossy paper 50 × 50 mm 1.969 × 1.969 in), the sensing range shortens, as shown in the left graph. (For plotting the left graph, a sensor having a sensitivity such that it can just detect a 50 × 50 mm 1.969 × 1.969 in white non-glossy paper at a distance of 38 mm 1.496 in has been used.) |
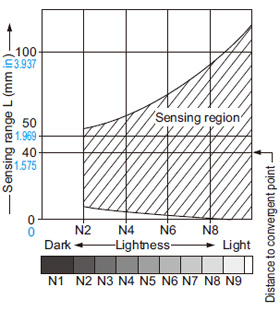
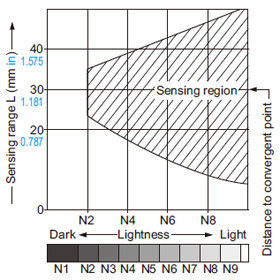
Correlation between lightness and sensing range
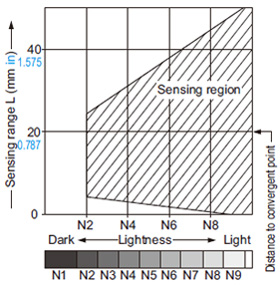 |
The sensing region (typical) is represented by oblique lines in the left figure. However, the sensitivity should be set with enough margin because of slight variation in products. (Lightness shown on the left may differ slightly from the actual object condition.) |
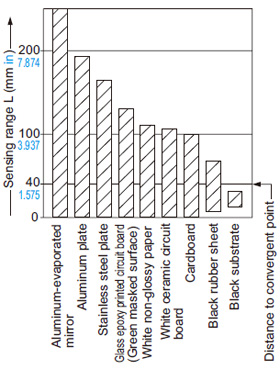
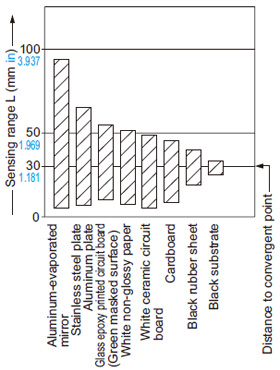
Correlation between material (50 × 50 mm 1.969 × 1.969 in) and sensing range
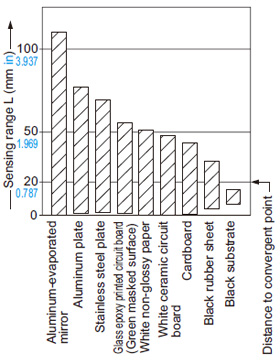 |
The bars in the graph indicate the sensing range (typical) for the respective material. |
EX-44
|
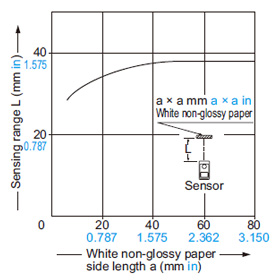
Correlation between sensing object size and sensing range
 |
As the sensing object size becomes smaller than the standard size (white non-glossy paper 50 × 50 mm 1.969 × 1.969 in), the sensing range shortens, as shown in the left graph. (For plotting the left graph, the sensitivity has been set such that a 50 × 50 mm 1.969 × 1.969 in white non-glossy paper is just detectable at a distance of 70 mm 2.756 in.) |
Correlation between lightness and sensing range
 |
The sensing region (typical) is represented by oblique lines in the left figure. However, the sensitivity should be set with enough margin because of slight variation in products. (The graph is drawn for the maximum sensitivity setting.) (Lightness shown on the left may differ slightly from the actual object condition.) |
Correlation between material (50 × 50 mm 1.969 × 1.969 in) and sensing range
 |
The bars in the graph indicate the sensing range (typical) for the respective material. (The graph is drawn for the maximum sensitivity setting.) |
EX-43
EX-43T (Discontinued products)
|
Correlation between lightness and sensing range
 |
The sensing region (typical) is represented by oblique lines in the left figure. However, the sensitivity should be set with enough margin because of slight variation in products. (The graph is drawn for the maximum sensitivity setting. However, EX-43T does not incorporate the sensitivity adjuster.) (Lightness shown on the left may differ slightly from the actual object condition.) |
Correlation between material (50 × 50 mm 1.969 × 1.969 in) and sensing range
 |
The bars in the graph indicate the sensing range (typical) for the respective material. (The graph is drawn for the maximum sensitivity setting. However, EX-43T does not incorporate the sensitivity adjuster.) |
BY EMAIL
- U.S.A.
- +1-800-344-2112
- Europe
- +49-89-45354-1000
- China
- +86-10-59255988
- Singapore
- +65-6299-9181


Requests to customers (Automation Control Components & Industrial Device) [Excluding specific product]
Requests to customers (Automation Control Components & Industrial Device) [For specific product]
Requests to customers (FA Sensors & Components [Excluding motors])
Requests to customers (Dedicated to industrial motors)
- COMPONENTS & DEVICES
- FA SENSORS & COMPONENTS
- Fiber Sensors
- Photoelectric Sensors / Laser Sensors
- Micro Photoelectric Sensors
- Light Curtains / Safety Components
- Area Sensors
- Inductive Proximity Sensors
- Particular Use Sensors
- Sensor Options
- Wire-Saving Systems
- Programmable Controllers / Interface Terminal
- Human Machine Interface
- Pressure Sensors / Flow Sensors
- Measurement Sensors
- Static Control Devices
- Laser Markers / 2D Code Readers
- Machine Vision System
- Energy Management Solutions
- Timers / Counters / FA Components
- MOTORS
![]()