[System Maintenance Notice]
Due to ongoing system maintenance, the site search and specification search functions are temporarily unavailable. We apologize for any inconvenience this may cause and appreciate your understanding.
【Notification of Manufacturer Change for Panasonic Industrial Devices SUNX Products and Panasonic Industrial Devices SUNX Tatsuno Products】
From April 1, 2024, the terms "Panasonic Industrial Devices SUNX Co., Ltd." and "Panasonic Industrial Devices SUNX Tatsuno Co., Ltd."
in this page and in the manuals and other documents to be downloaded will all be replaced with "Panasonic Industry Co., Ltd." and applied accordingly.

 Business
> Industrial Devices
> Automation Controls Top
> Service & Support
> FA Technical Support
> Glossary of FA Sensors
> Photoelectric Sensors
> Parallel deviation
Business
> Industrial Devices
> Automation Controls Top
> Service & Support
> FA Technical Support
> Glossary of FA Sensors
> Photoelectric Sensors
> Parallel deviation
Parallel deviation - Glossary - Photoelectric Sensors
Parallel deviation
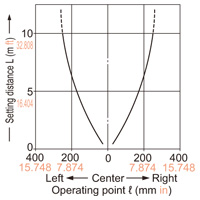
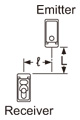
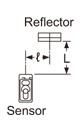
The angular deviation diagram of the thru-beam type and the retroreflective type sensors represents the angular range within which the receiver will effectively see the emitted light beam.
The curves are plotted as a series of points representing the angle at which the sensor enters the beam received condition as the angle is gradually reduced by moving the sensor or the reflector towards the center axis from the left or the right at different setting distances (with the sensitivity adjuster at maximum sensitivity).
The graph is useful to find the tolerable misalignment angle. (Note)
|
|
|
| Note : | These are typical graphs, and are subject to slight changes from model to model. |
|---|
Other terms
- Beam envelope / Beam axis
- Sensing axis
- Sensing range / Distance to convergent point
- Standard sensing object
- Minimum sensing object
- Hysteresis
- Repeatability
- Response time
- Ambient illuminance
- Protection
- Sensing height (Protective height)
- Parallel deviation
- Angular deviation
- Sensing field
- Correlation between sensing object size and sensing range
- Correlation between lightness and sensing range
- Correlation between material and sensing range
- Correlation between color and sensing range
- Correlation between setting distance and excess gain
Related Products
BY EMAIL


Requests to customers (Automation Control Components & Industrial Device) [Excluding specific product]
Requests to customers (Automation Control Components & Industrial Device) [For specific product]
Requests to customers (FA Sensors & Components [Excluding motors])
Requests to customers (Dedicated to industrial motors)
- COMPONENTS & DEVICES
- FA SENSORS & COMPONENTS
- Fiber Sensors
- Photoelectric Sensors / Laser Sensors
- Micro Photoelectric Sensors
- Light Curtains / Safety Components
- Area Sensors
- Inductive Proximity Sensors
- Particular Use Sensors
- Sensor Options
- Wire-Saving Systems
- Programmable Controllers / Interface Terminal
- Human Machine Interface
- Pressure Sensors / Flow Sensors
- Measurement Sensors
- Static Control Devices
- Laser Markers / 2D Code Readers
- Machine Vision System
- Energy Management Solutions
- Timers / Counters / FA Components
- MOTORS
![]()