[System Maintenance Notice]
Due to ongoing system maintenance, the site search and specification search functions are temporarily unavailable. We apologize for any inconvenience this may cause and appreciate your understanding.
【Notification of Manufacturer Change for Panasonic Industrial Devices SUNX Products and Panasonic Industrial Devices SUNX Tatsuno Products】
From April 1, 2024, the terms "Panasonic Industrial Devices SUNX Co., Ltd." and "Panasonic Industrial Devices SUNX Tatsuno Co., Ltd."
in this page and in the manuals and other documents to be downloaded will all be replaced with "Panasonic Industry Co., Ltd." and applied accordingly.

 Business
> Industrial Devices
> Automation Controls Top
> FA Sensors & Components
> Energy Management Solutions
> Software
> Digital Signage Software EnerVisualizeR
Business
> Industrial Devices
> Automation Controls Top
> FA Sensors & Components
> Energy Management Solutions
> Software
> Digital Signage Software EnerVisualizeR
Digital Signage Software EnerVisualizeR
|
Discontinuation plan
|
|
Share your information, and work together toward the same goal.
Free from annual license fee and cost effective!
|
Make the most of your data measured and collected.
Perfect to intuitively share any information you want such as energy consumption,
and work together to achieve the common goal.
| * | There might be areas or countries this product can't be supported.Please ask our local sales office for the availability. |
|---|
Features
See "Data" page for free of charge EnerVisualizeR graphic data.
You can download the data for free from our website.
![[Present]](/ac/e/fasys/eco/software/enervisualizer/images/pic101.jpg)
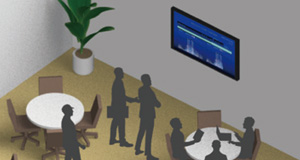
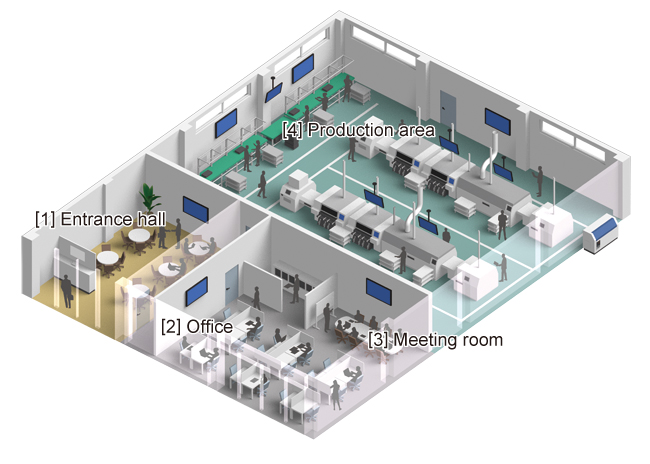
The digital signage function of EnerVisualizeR promotes active participation of employees in energy-saving activities.
It can also be used to show energy-saving activities conducted at the facility to visiting customers.
|
|
|
|

Application example
|
|
|
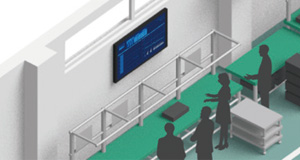
 Demonstrates your efforts on energy saving to your visitors.
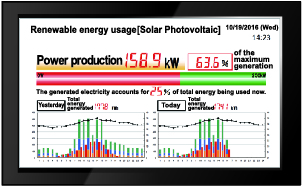
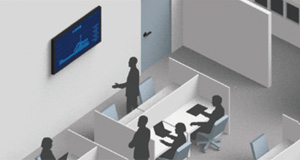
 Share your efforts on energy saving among all workers
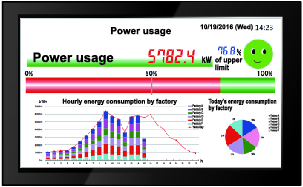
|
|
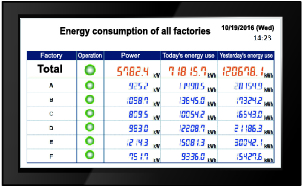
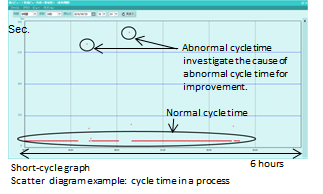
 Discover abnormality in an early stage
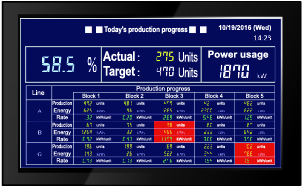
![[Monitor] Real-time monitoring and short-cycle graph](/ac/e/fasys/eco/software/enervisualizer/images/pic301.jpg)
Predictive monitoring is conducted every minute to check the possibility of the demand exceeding the set value. If the demand is about to exceed the set level, a 3-stage alarm is generated.
Information of the demand can be displayed on the digital signage. Past records, graphs and numerical data can be output as a hard copy for easy confirmation.
|
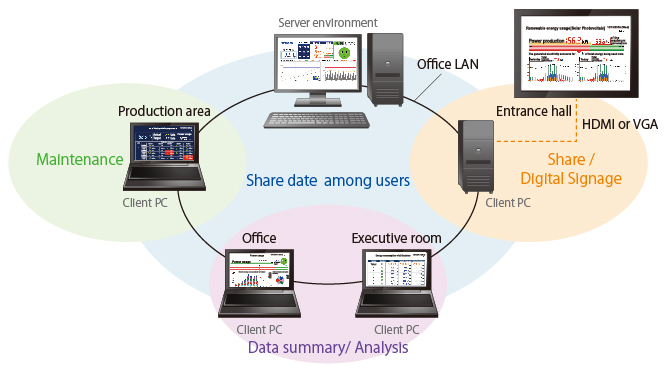
![[Share & Analyze] Data summary for sharing, and analysis](/ac/e/fasys/eco/software/enervisualizer/images/pic201.jpg)
Data accumulated and compiled by EnerVisualizeR can be shared by multiple clients using Web service.
Each user can conduct detailed analysis using the 1-sec. cycle view function.
Users can also plot graphs and output data in a report form.
|
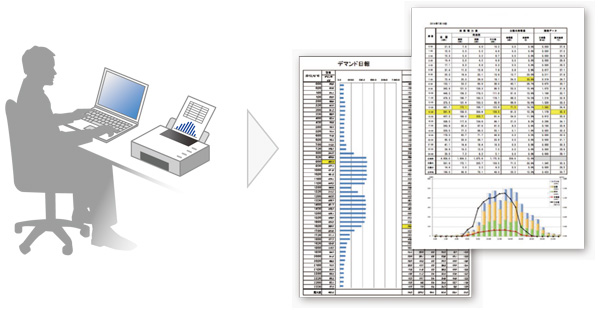
![[Organize] Custom reports](/ac/e/fasys/eco/software/enervisualizer/images/pic401.jpg)
Daily / weekly / monthly report can be automatically produced based on the data accumulated and Compiled By EnerVisualizeR. Since the document is output as a Microsoft® Excel® file, the user can change the layout easily.
* Documents are prepared based on the data collected by EnerVisualizeR. Regarding the data collection period and frequency, refer to the EnerVisualizeR User's Manual.
|
|
BY EMAIL
- U.S.A.
- +1-800-344-2112
- Europe
- +49-89-45354-1000
- China
- +86-10-59255988
- Singapore
- +65-6299-9181


Requests to customers (Automation Control Components & Industrial Device) [Excluding specific product]
Requests to customers (Automation Control Components & Industrial Device) [For specific product]
Requests to customers (FA Sensors & Components [Excluding motors])
Requests to customers (Dedicated to industrial motors)
- COMPONENTS & DEVICES
- FA SENSORS & COMPONENTS
- Fiber Sensors
- Photoelectric Sensors / Laser Sensors
- Micro Photoelectric Sensors
- Light Curtains / Safety Components
- Area Sensors
- Inductive Proximity Sensors
- Particular Use Sensors
- Sensor Options
- Wire-Saving Systems
- Programmable Controllers / Interface Terminal
- Human Machine Interface
- Pressure Sensors / Flow Sensors
- Measurement Sensors
- Static Control Devices
- Laser Markers / 2D Code Readers
- Machine Vision System
- Energy Management Solutions
- Timers / Counters / FA Components
- MOTORS
![]()